
The crypto tokens are volatile digital assets. The price varies based on various factors such as market sentiment, the trend of the major cryptocurrencies, and one of the main factors include the positive news about the Crypto. 1inch, Enjin Coin, NKN, and Origin Token are the cryptocurrencies that got hit with the news effect.

Coinbase, the largest crypto-exchange of North America, announced the listing of 1inch, Enjin Coin, NKN, and Origin Tokens that triggered the bulls and has taken the prices higher.
Let us analyse these digital assets with the help of Technical Price analysis.
1inch Technical Price Analysis
1inch has been performing very well, but after the announcement of Coinbase listing, it has rocketed to hit new levels. The ATH recorded at $6.50 on April 8th.
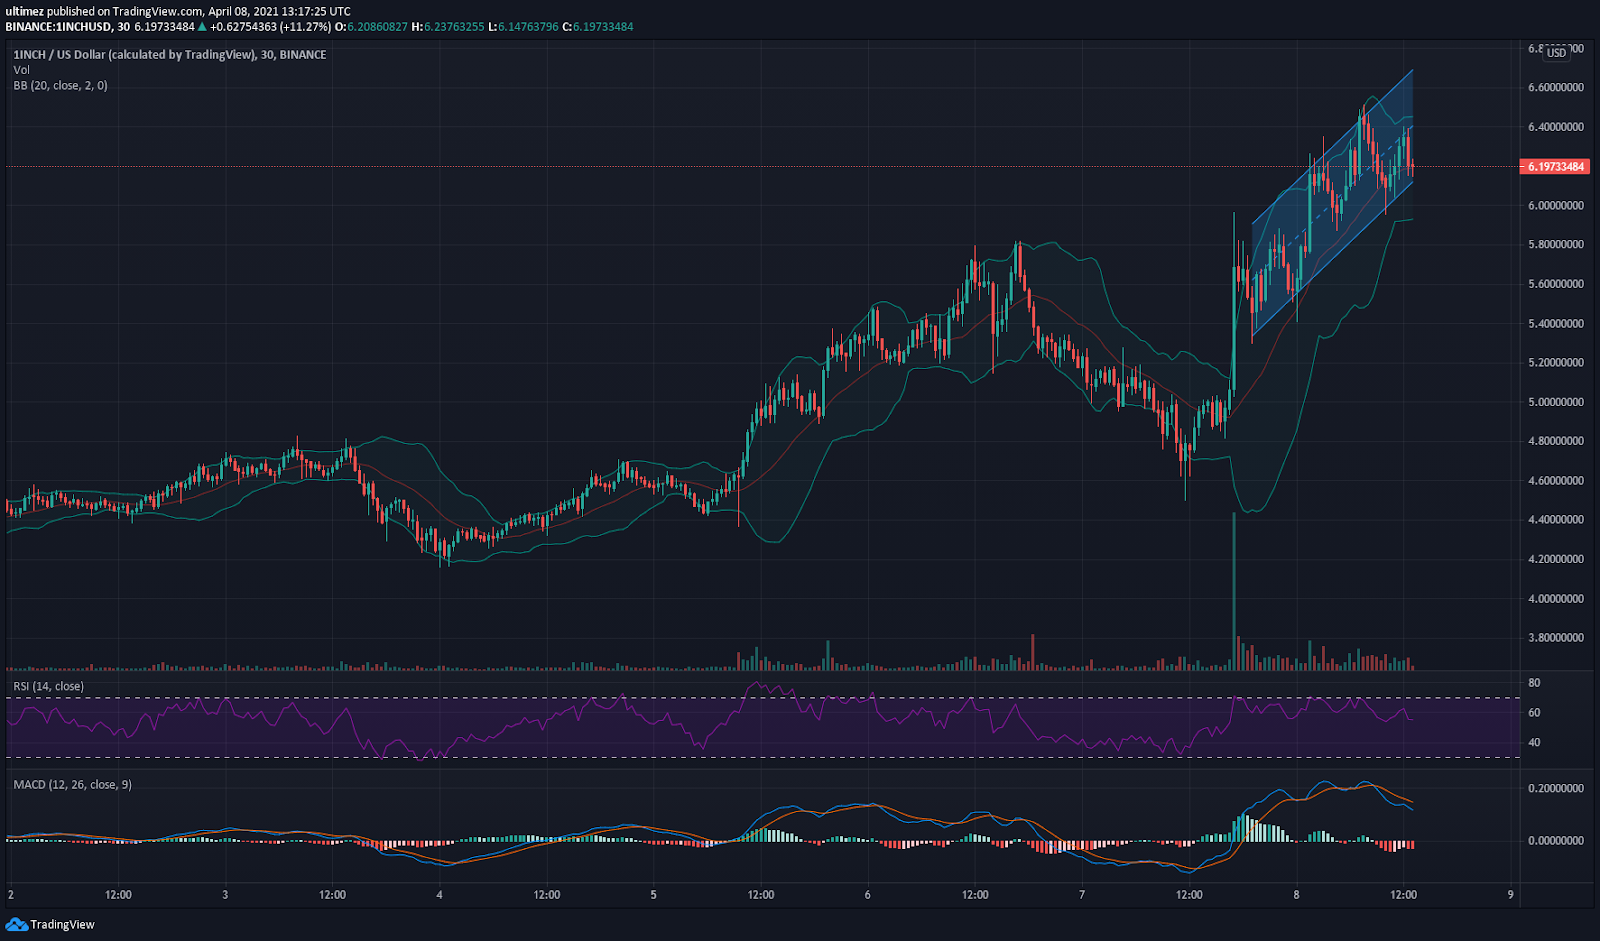
1inch is currently following the ascending pattern after the breakout. With primary supports at $6 and $5.6. The resistances are $6.5 and $6.8 according to price action and Fibonacci charts. The RSI at 55 indicates moderate bullishness. MACD also indicates bulls ruling the price.
Support Levels: $6 and $5.6
Resistance Levels: $6.5 and $6.8
RSI: 55
Enjin Coin(ENJ)Technical Price Analysis
ENJ jumped a 44.06% jump and is trading at $3, and boasts a market capitalization of $2,501,772,295. The 30 minutes chart showed the trading halts at points, which changed after the announcement of the coinbase.

The important supports are $2.8 and $2.6 as per the trends. It is difficult to identify the supports and resistance as per price action. But the resistance for the ENJ lies at $3.03 and $3.15 approximately. RSI and MACD indicate bullishness.
Support Levels: $2.8 and $2.6
Resistance levels: $3.03 and $3.15
RSI: 60
Nkn(NKN)Technical Price Analysis
NKN jumped about 86.28% jump and is trading at $0.9186, and boasts a market capitalization of $536 Million. The 30 minutes chart showed the bullishness, which changed after the announcement of the coinbase.

The important supports are $0.8 and $0.7 as per the trends. The resistance for the NKN lies at $0.95 and $1 approximately. RSI and MACD indicate bullishness.
Support Levels: $0.8and $0.7
Resistance levels: $0.95 and $1
RSI: 65.17
Origin Protocol(OGN)Technical Price Analysis
OGN jumped about 43.42% jump and is trading at $$3.20, and boasts a market capitalization of $885.5 Million. The 30 minutes chart showed the bullishness, which changed after the announcement of the coinbase.

The important supports are $3.15 and $3 as per the trends. The resistance for the OGN lies at $3.4. RSI and MACD indicate bullishness.
Support Levels: $3.15 and $3
Resistance levels: $3.4
RSI: 54
Source link
