
Terra (LUNA) is currently tiptoeing sideways after a mild advance over the weekend. Terra (LUNA) rallied impressively on Friday, capping an extremely volatile prior week.
*Terra (LUNA) suffered rejection after attaining new all-time highs of $23.27
*LUNA’s overall price action remains consolidative
*Anchor Protocol launch remains the biggest catalyst of the Terra price
Terra (LUNA) suffered rejection after attaining new all-time highs of $23.27, closing in the negative territory for 4 straight days before staging a rebound on Friday. After a recent bounce off a critical support base, Terra (LUNA) trades sideways past a $17.85 low. LUNA’s overall price action remains consolidative while attempting to form long-term support between $17.82 to $18.80, setting the scene for a move back to its all-time highs of $23.29 if all goes to plan. The next major directional move is likely to take place once the $19.50 ceiling of the sideways developing pattern range is breached with conviction. Should upside momentum start to weaken, sellers may encounter initial downside constraints from the nearby lower wicks of $17.82 and $16.31 respectively.

Anchor Protocol Launch Remains the Biggest Catalyst of Terra (LUNA) Price
Terra price rose to all-time highs of $23.22 following the Anchor protocol release on Mar. 17. Anchor Protocol is a savings platform offering low-volatile yields built on top of Terra. There are likely two key reasons why Terra struggled in the prior week. The potential reasons are uncertainty in the market and a sell-the-news drop after the Anchor protocol release. The biggest catalyst of the Terra price in the previous months has been the airdrop of ANC tokens. Anchor Protocol reportedly stated it will airdrop a total quantity of 50,000,000 ANC to early LUNA stakers while an additional pool of 100M ANC will be distributed every week to LUNA stakers for the next two years.
LUNA Daily Chart: Ranging
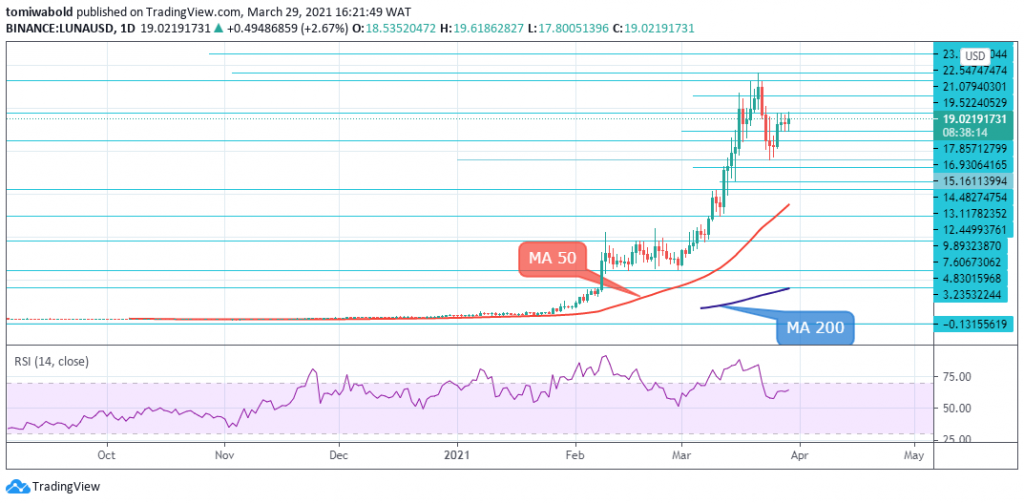
LUNA is consolidating under the $19.50 barrier cap on Monday, after failed breakout attempts in the last two days. To the upside, bulls will need to remove the $19.50 cap to bring back confidence. After that, an extended rally may carry LUNA price to all-time highs at $23.22. The oscillators are slightly favoring the upside as seen in the upsloping moving averages while the RSI hovers above the bullish 50 levels.
On the other hand, a bearish breakout beneath $17.85 could deepen the correction towards $15.16. Terra has additional support at $13.10 followed by the MA 50 at $10.98. Summarizing, the Terra price action seems to be tilting to the upside. A break of the floor of $17.85 or the ceiling of $19.50 would confirm the next price direction.
LUNA 4-Hour Chart: Ranging
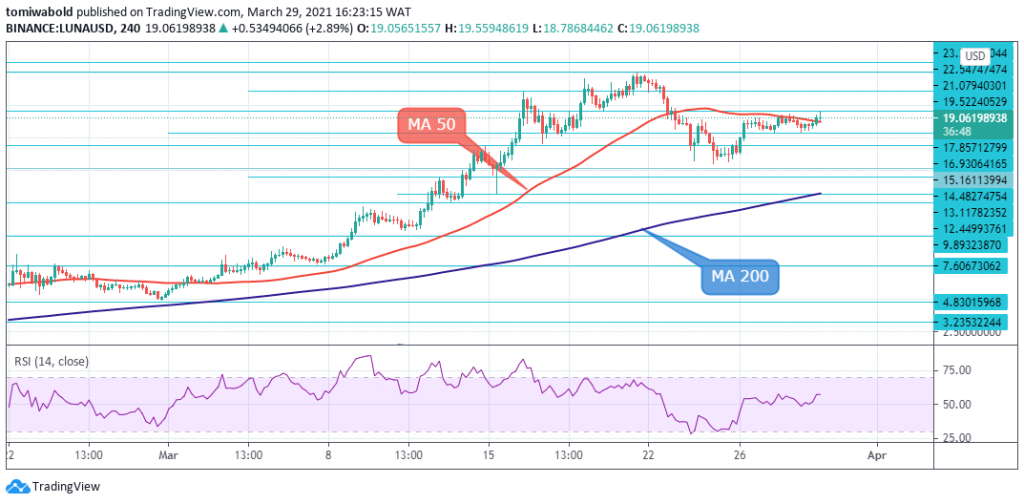
A steady climb above the MA 50 barrier cap at $18.77 suggests that bulls remain firmly in play for the attack at the $20 psychological level. Despite this, Luna’s upside bias remains within the 4-hour MA 50 and a sustained range breakout must take place for Terra (LUNA) to drift higher. Surpassing this, buyers will still need to beat the resistance at $19.50 before tackling the $20 psychological level.
If buying interest intensifies, the $21.62 and $22.27 highs could then challenge buyers’ efforts to re-establish a climb. On the contrary, should upside momentum start to weaken, sellers may encounter initial downside constraints from the $17.85 support. Steering Terra (LUNA) lower, the crucial support at $15.43 could prove to be a noteworthy obstacle to overcome. Only a firm break here would sideline bulls for a deeper correction.
Key Levels
Resistance Levels: $27.20, $25.00, $23.71
Support Levels: $17.85, $16.93, $15.43
Image Credit: Tradingview
Note: coinpedia.org is not a financial advisor. Do your research before investing your funds in any financial asset or presented product or event.
Source link