
Buying sentiment for the Tezos (XTZ) market continues to spur substantial progress on its price after correcting from ATH of $6.82 on Tuesday while taking the bull by the horn from its rebound at the $5.37 low level.
*Tezos is aiming for new record highs beyond the $6.82 ATHs
*OpenSea, an Ethereum-based NFT platform, plans to add Tezos-based NFTs
Tezos (XTZ) bulls are pushing up to new highs at the time of writing, amidst the risk-on party in the global cryptocurrency market. The XTZ/USD has retracted during the mid-week after hitting the $6.82 fresh ATHs. We should see a further move up. The buying sentiment on Tezos strong recovery continues to unleash upside potential beyond the recent downside correction at the $5.37 low level. Tezos medium-term focus is aiming for new record highs beyond the $6.82 ATHs. At the time of writing, the asset is currently 28th on the Coinmarketcap table, with a market cap of $4.75B, and $561 million in trade volume over the past 24 hours.

Kalamint, Tezos NFT Platform Goes Live
As of March 2021, Kalamint, Tezos highly awaited NFT platform launched on the Tezos blockchain, making it possible to mint, sell, and buy NFTs thereby buoying the price of XTZ. Tezos’ first community-owned public NFT marketplace is Kalamint. Users can build and mint native Tezos NFTs using the FA2 token standard on the platform. It will also allow for the purchase and sale of NFTs. In almost every Indian subcontinent language, the word ‘Kala means ‘art.’ Kalamint aspires to be a symbol of art, vitality, and color! Additionally, OpenSea, an Ethereum-based NFT platform, plans to add Tezos-based NFTs.
XTZ Daily Chart: Bullish
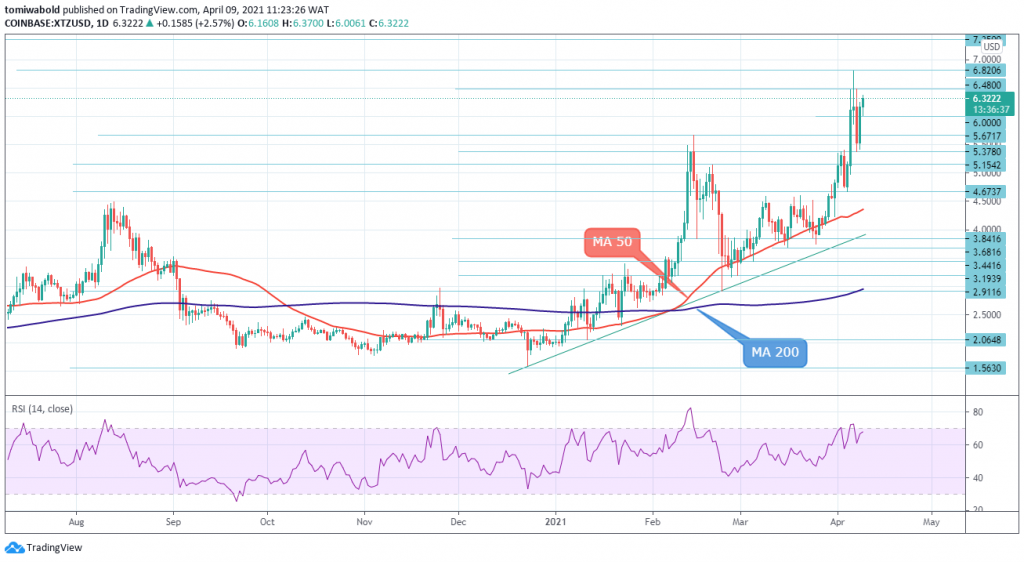
On the daily time frame, the $6.48 zone is a breakout-retest area. If the impulse is positive with enough momentum to the upside, we should see $6.82 and $7.35 levels in a short time. Meanwhile, the daily charts technical perspective shows the retracement towards the $5.37 horizontal support level should hold for bulls. However, bulls should not allow the price to drop below $5.37 for this scenario to be valid.
Technicals analysis on the chart turned bullish and daily indicators strengthen as fresh bullish acceleration emerged after downside attempts stalled on the approach to the downside consolidation channel from $4.67 to $5.37 levels. XTX medium-term focus shifts towards the upper boundary of the weekly range ($6.48/$6.82), but the action may remain in sideways mode as long as it holds within its range.
XTZ/USD 4-Hour Chart: Bullish

XTZ’s recent rebound from a $5.37 low occurred at the doorstep of the 4-hour moving average (MA 50) indicating a strong support zone has been structured before the correction. A double top pattern on the 4-hour time frame is building up, as it weighs along with rising bullish momentum that may later trigger a deeper pullback which needs an initial signal on a daily close below the $6.82 ATHs in the event of a failure.
On the contrary, to validate a bearish return, the bears may need to claim the MA 50 and MA 200 at $5.55 and $4.50, respectively. The XTZ/USD pair is only bullish when trading above the $5.55 mark, with resistance at $6.48 and $6.82 region. Sellers may test the $5.67 and $5.37 levels if the XTZ/USD pair trades below the $6.0 level.
Key Levels
Resistance Levels: $7.35, $6.82, $6.48
Support Levels: $5.67, $5.37, $4.67
Image Credit: Tradingview
Note: coinpedia.org is not a financial advisor. Do your research before investing your funds in any financial asset or presented product or event.
Source link
