
The Stellar (XLM) price holds in green for the 3rd consecutive day as buyers tighten grip after a break of pivotal barrier at $0.4250 level. XLM/USD downside rebound eventually caused a surge.
*XLM rebounded from the recent low level at $0.3420 on March 25
*XLM/USD may push through upside barriers past the $0.60 high region
*XLM is more inclined towards utility rather than being a security token
XLM/USD advanced nearly 22% vs USD in the past 7 days amid the steady acceleration at the end of March with a bullish candle. XLM rebounded from the recent low level at $0.3420 on March 25 after a mild correction swept through the cryptocurrency market. Stellar’s significant supply zones are still in place but emerging trends on the XLM/USD may push through upside barriers past the $0.60 high region. Technicals suggest the continuation of the ongoing upside traction with a price surge given Stellar’s potential positive outlook.

SDF CEO Denelle Dixon Illuminates Stellar As Utility Token
Although similar to Ripple (XRP), Stellar Development Foundation has managed to distance itself from the SEC lawsuit. However, there are still doubts among holders about the status of the XLM token given the fact that Stellar Lumens (XLM) is being led by Jed McCaleb, a former executive at Ripple. While highlighting the use cases of the network and the use of Stellar during an interview, SDF CEO Denelle Dixon said that XLM is more inclined towards utility rather than being a security token.
XLM Daily Chart: Ranging
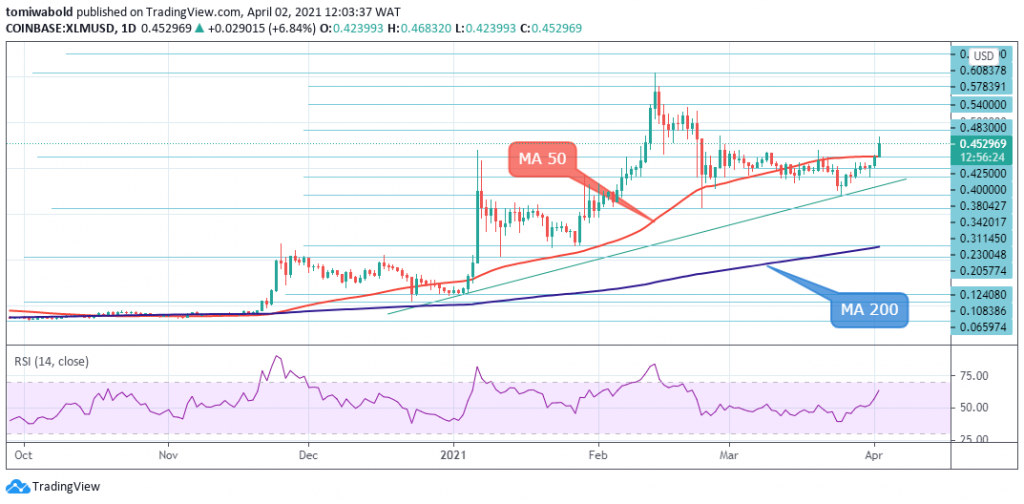
The daily timeframe is in full bullish setup with a yet overbought price as the relative strength index (RSI) warns of the emerging trend before bulls breakout. XLM/USD prior pivotal zone at $0.4250 is being reinforced by rising moving average (MA 50) reverted to solid supports which should keep the downside protected.
On the whole, increased volumes will propel bulls to eye targets at $0.608 (Feb. 2021 peak) and a break of which would open the way for an attack at the $0.65 resistance zone. Everything being equal, the rate could continue to surge in an ascending pattern during the following trading sessions. The possible target for buyers in the medium term is the $0.5400 level.
XLM 4-Hour Chart: Bullish
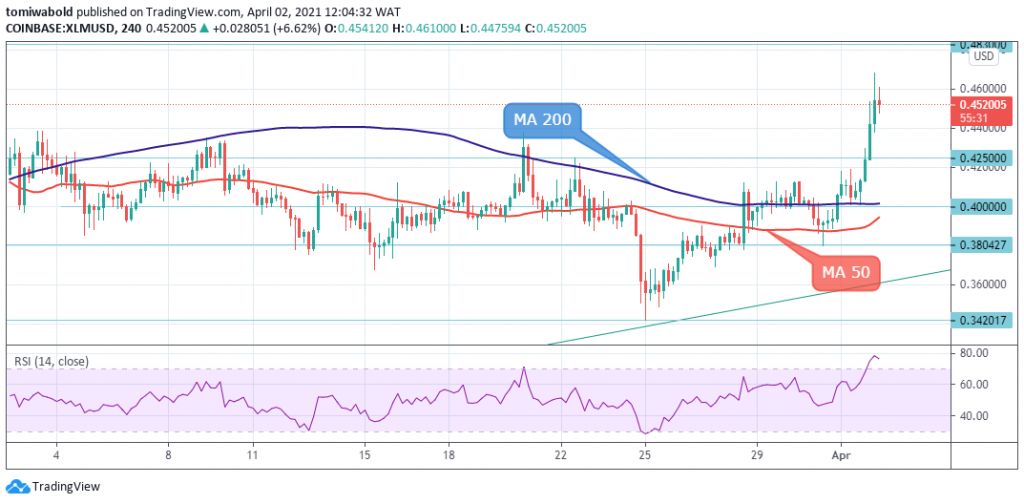
At the 4-hour moving average (MA 200) support near the $0.4000 level, the bulls eventually led a surge of 5 bullish candles. It resulted in a sustained upside run, which by the middle of Friday’s trading hours had reached the $0.4683 level. Bulls are taking a breather beneath the intraday’s high with consolidation on overextended 4-hour candles which is likely to precede fresh weakness.
Corrective downticks should be limited at the $0.4000 lift-off zone to keep bears intact. The formation of an outside candle adds to the positive setup of the short-time techs as a massive 4-hour bullish candle weighs heavily. Overall near-term sentiment stays bullish as the emerging trends may push through upside barriers past $0.60 highs.
Key Levels
Resistance Levels: $0.6083, $0.5400, $0.4830
Support Levels: $0.4250, $0.4000, $0.3804
Image Credit: Tradingview
Note: coinpedia.org is not a financial advisor. Do your research before investing your funds in any financial asset or presented product or event.
Source link
