
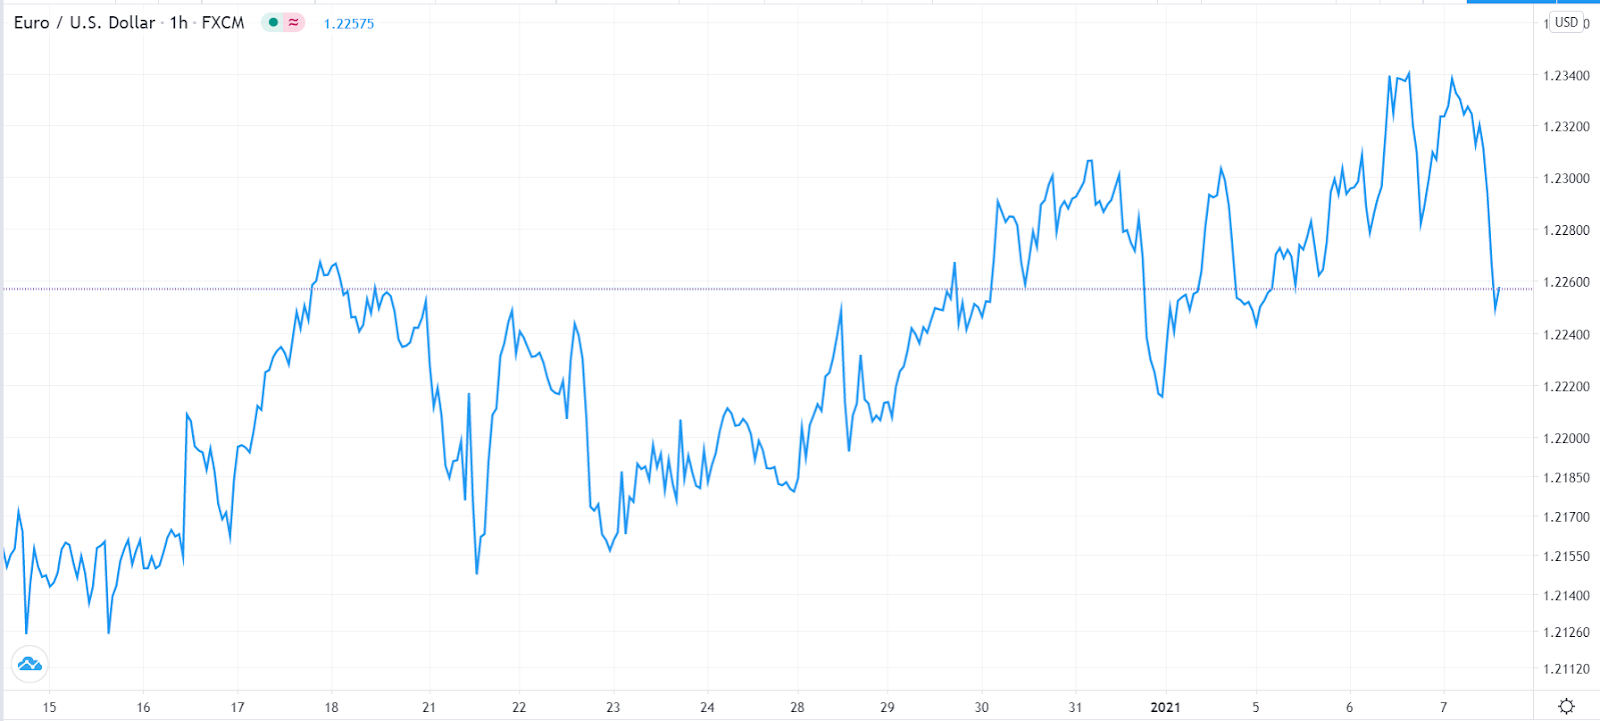
- The EUR/USD pair has formed a divergence pattern on the four-hour chart.
- It is reacting to the relatively weak economic data from the European Union.
- EU retail sales slumped in November while inflation remained muted in December.
The EUR/USD pair is down by more than 0.50% today after the relatively weak economic data from the European Union. Forex traders are also reacting to the Georgia victory by Democrats and the political turmoil in Washington.
Eurozone retail sales slumped
The retail sector is integral to most economies because of the number of people it employs and its role on inflation. As such, traders always pay close attention to the monthly retail sales numbers.
Are you looking for fast-news, hot-tips and market analysis?
Sign-up for the Invezz newsletter, today.
In a report today, Eurostat said that the Eurozone’s retail sales slumped in November. Precisely, the headline retail sales dropped by 6.1% in November after rising by 1.4% in the previous month. Economists polled by Reuters were expecting the sales to drop by just 3.4%. This decline caused the sales to drop by an annualised rate of 2.9% after rising by 4.2% in October.
This performance was mostly due to the new wave of the coronavirus that forced more countries to issue stay-at-home orders.
Meanwhile, the EUR/USD also dropped because of the weak preliminary inflation data from the region. In December, consumer prices dropped by an annualised rate of 0.3%, which was lower than the expected decline of 0.2%. The core CPI, which excludes the volatile food and energy products, rose by just 0.2%.
Further data from Europe showed that the industrial sentiment improved to -7.2 in December because of the new vaccines. The services segment declined to -17.4 while consumer sentiment improved to -13.9.
Looking ahead, the EUR/USD will react to the US nonfarm payroll numbers that will come out tomorrow. Economists expect the data to show that the unemployment rate rose to 6.8% as the economy added fewer jobs.
EUR/USD technical outlook
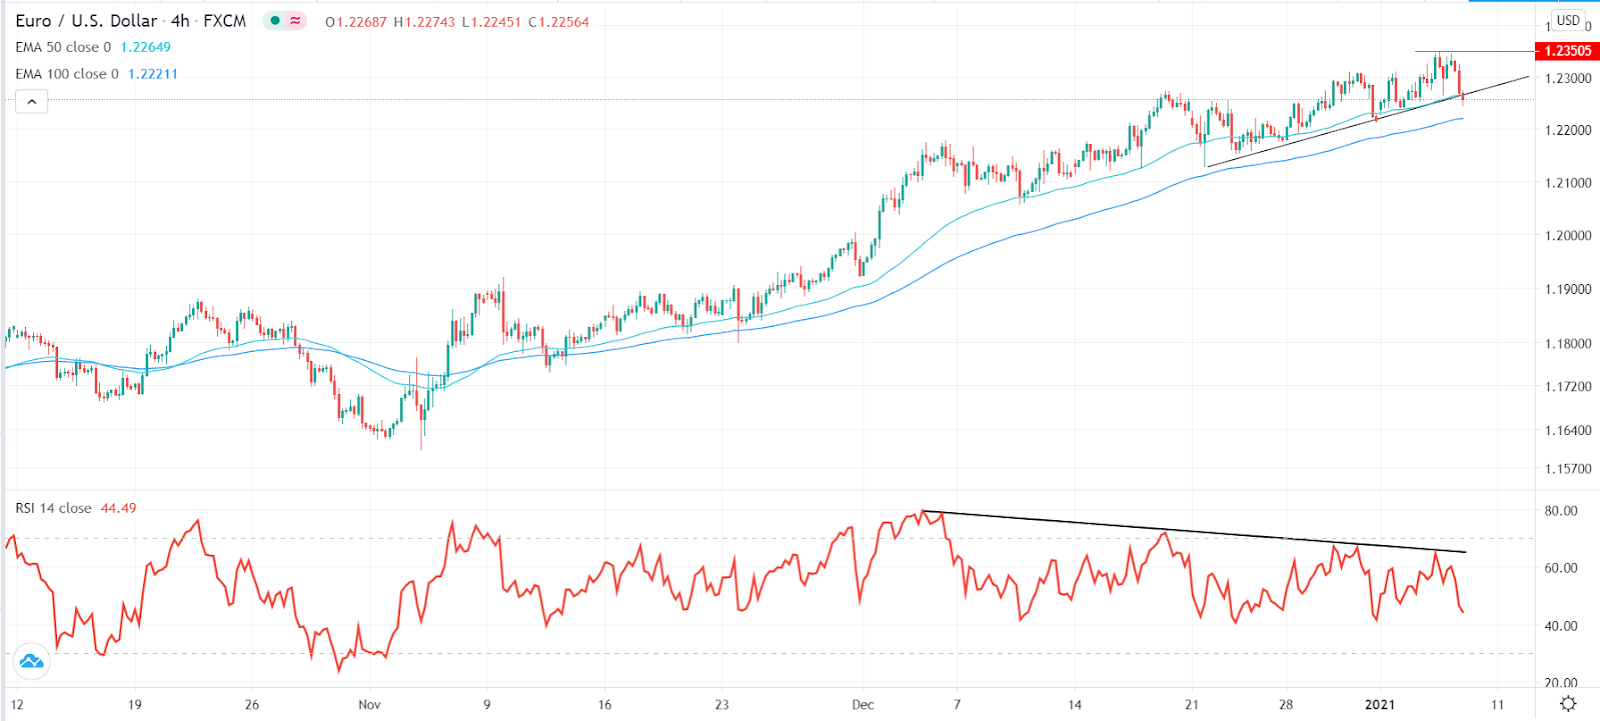
Looking at the four-hour chart, we see that the EUR/USD pair has dropped substantially from the highest point this week. Subsequently, the price has moved below the 50-day hull moving average.
There are two other notable observations. First, the pair has moved below the ascending trendline that’s shown in black. Second, the Relative Strength Index (RSI) shows that a bearish divergence is happening. To see this, we have drawn a falling trendline connecting the highest points on the indicator. You can learn how to do this in our free forex trading course.
Therefore, in the near term, the EUR/USD will likely continue falling, with the next target being at 1.2200.
Source link


