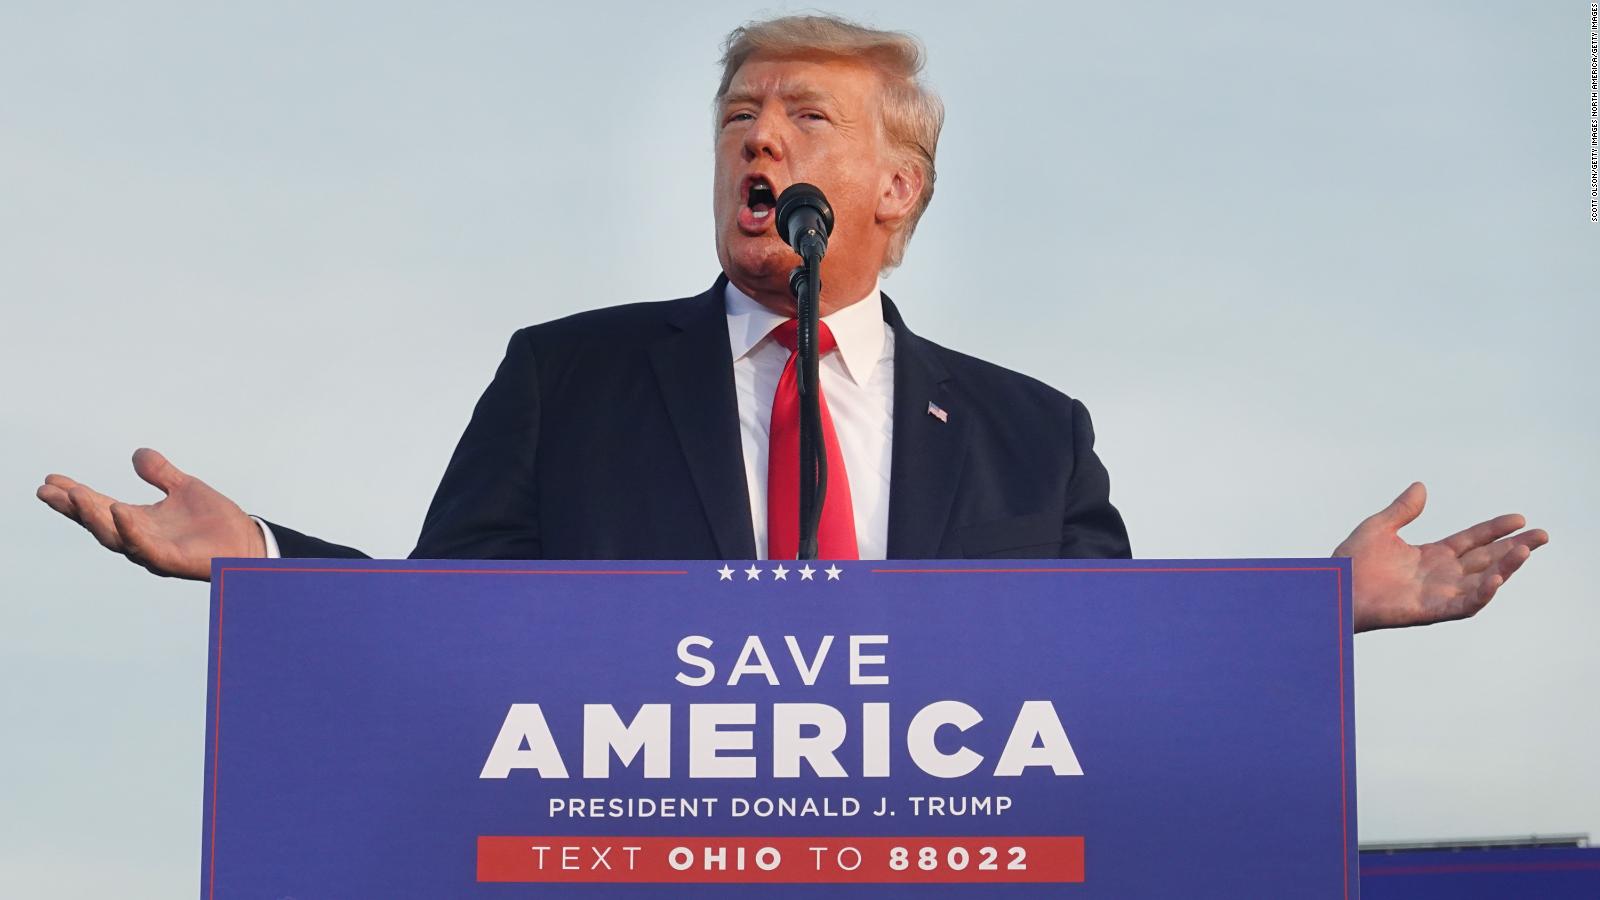
(Trends Wide Spanish) — As the vote count ends after the midterm elections in the United States, the final result of which will determine who will control Congress, many awaited Trump’s decision on his candidacy plans.
A third presidential aspiration to compete in 2024 —after winning the presidency in 2016 and losing re-election in 2020—, will start a new phase in his political career in which he will be on the defensive and constantly under siege, after disappointing results. of his party in the legislatures.
During his presidency, and also shortly after leaving it, Trump celebrated his administration’s alleged economic achievements, and is expected to speak of them again during his presidential campaign, now that he has announced his intention to run.
How did the US economy fare under Trump?
hard numbers
When Trump assumed the presidency, on January 20, 2017, the United States economy was in a period of growth that began after the Great Recession of 2009 and during the Government of Barack Obama, and in the following 3 years of his term. this trend continued.
The Gross Domestic Product grew 2.3% in 2017, 2.9% in 2018 and 2.3% in 2019, according to World Bank data. Then, however, came 2020: amid restrictions due to the covid-19 pandemic, the economy fell 3.4%.
It was the worst drop in the US economy in 74 years, according to Reuters.
And if you take a closer look, 2020 was truly a roller coaster: In the second quarter, as the country and the world were absorbing the worst of the pandemic, the US economy contracted 31.4% on an annualized basis, and then it rebounded 33.4% in the third quarter.
Trump received a nominal GDP at current prices of US$18.7 trillion (as of December 2016), and when he handed over power the GDP was US$20.89 trillion (as of December 2020). This is equivalent to a nominal GDP per capita of US$57,866 at the beginning of his term, and US$63,027 at the end, and that favorable result, even with the pandemic, to which the former president clings.
Unemployment at the end of 2016 stood at 4.9%, and fell to 4.4% in 2017—Trump’s first year in office—, to 3.9% in 2018, and to 3.7% in 2019. But in 2020, as a consequence of the sharp drop in GDP during the pandemic, climbed to 8.1% and the consequences are still being felt: some 22 million jobs created in previous years evaporated (by the end of 2020, 10.6 had been recovered millions).
Poverty in 2016, before the arrival of Trump, was 12.7%, and then it began to slowly decline: in 2017 it was 12.3%, in 2018 it was 11.8% and in 2019 it was 10.5%. While in 2020 poverty rose again to 11.5%.
The Trump Economy
In 2018 Trump achieved his greatest legislative achievement by getting Congress to pass a huge package of tax cuts, the basis of his economic program, which initially generated an acceleration in GDP growth.
But this acceleration peaked at full employment, and then began to reverse due, in part, to Trump’s many trade conflicts with different countries around the world, most importantly with China.
In addition, Trump added an increase in spending – mainly in Defense and in the economic aid packages against covid-19 – to his tax cut: the result was an increase in debt of about US $ 7 trillion during his term in office.
At the beginning of his presidency, the debt constituted 76% of GDP. In the end, it was 105%.
The Trump years are also remembered for the bullishness of stock markets on Wall Street, largely fueled by low interest rates, and these moves generated huge gains for the richest Americans.
In fact, the GINI index, which measures income inequality (where 0 is perfect equality and 100 is perfect inequality), began to rise since Trump came to power: it was 41.1 in 2016, 41.2 in 2017, 41.4 in 2018 and 41.5 in 2019 (last year with data).
With reporting from Annalyn Kurtz, Tal Yellin, Gabby Orr, Steve Contorno, Matt Egan, John Harwood, and Anneken Tappe.


